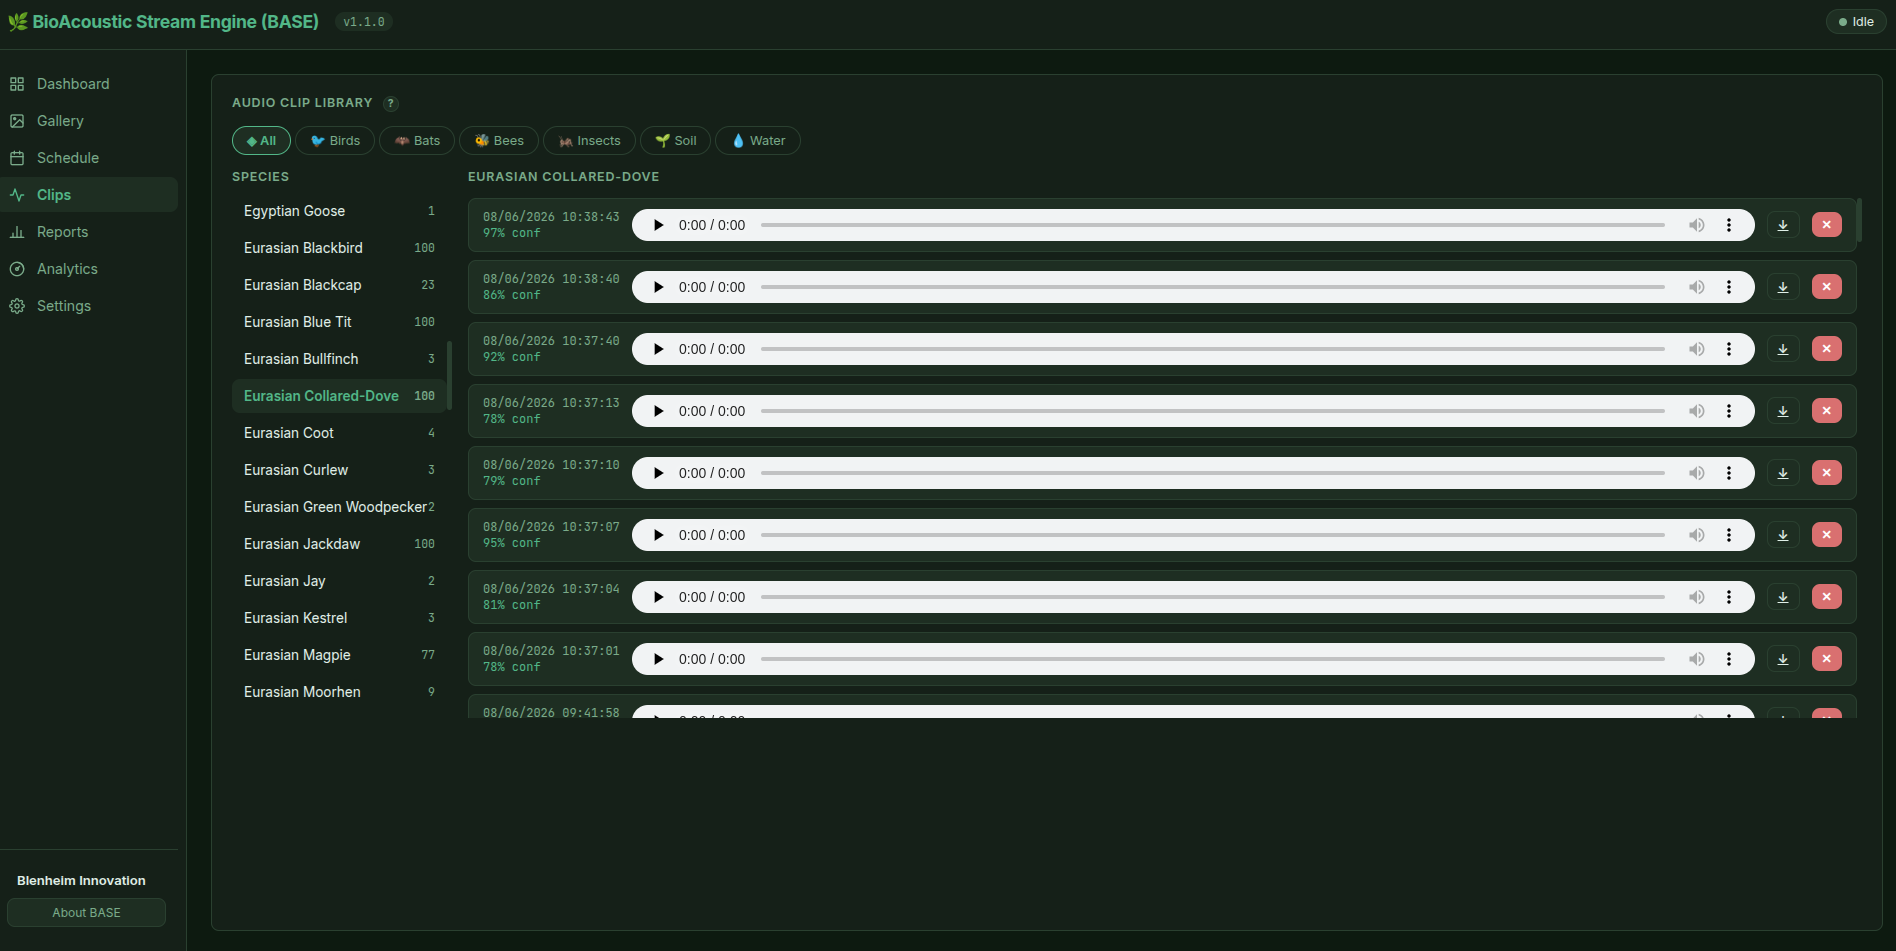
BASE is an open-source platform that listens continuously to the natural world — identifying birds, bats, bees, and more using AI. Built at Blenheim Palace to bring acoustic biodiversity monitoring within reach of everyone.
"Technology can bring people closer to the natural world. By making acoustic biodiversity monitoring open, accessible, and shareable, we can engage more people with nature — learning together, sharing what we hear, and building a deeper collective understanding of the living world around us."— David Green, Head of Innovation and AI, Blenheim Palace
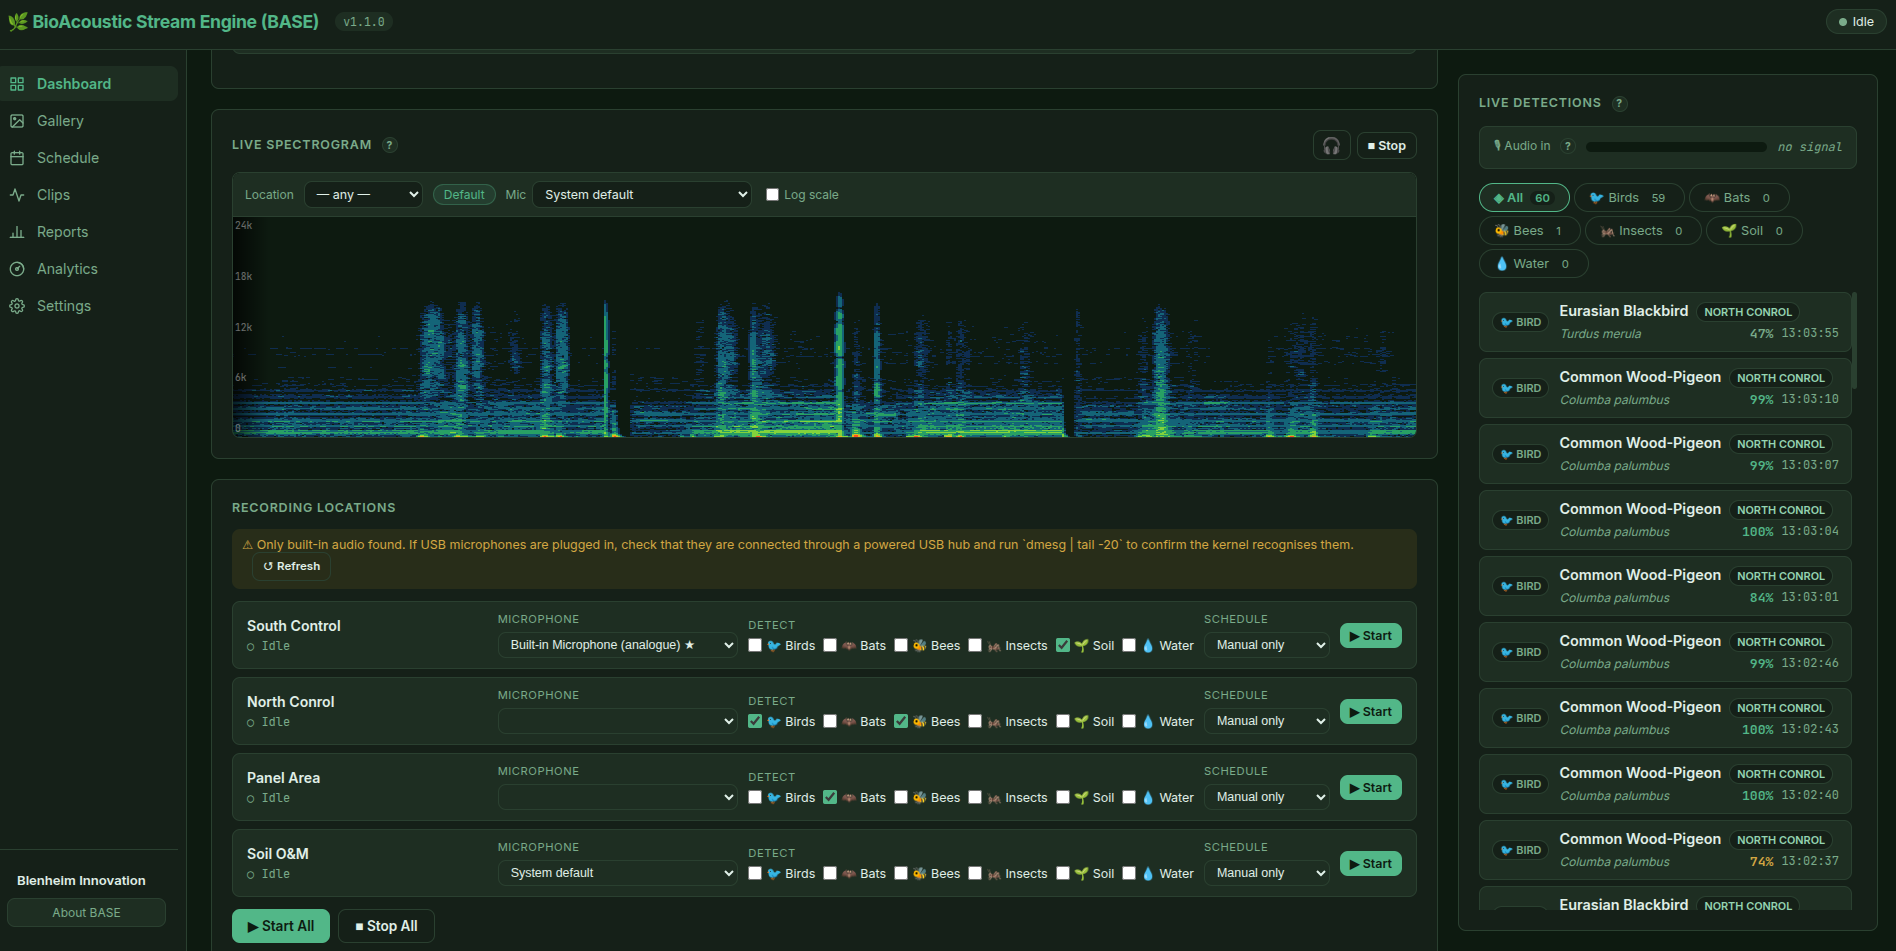
Each microphone can run multiple classifiers simultaneously. BASE works around the clock, pausing only when there is nothing to hear.

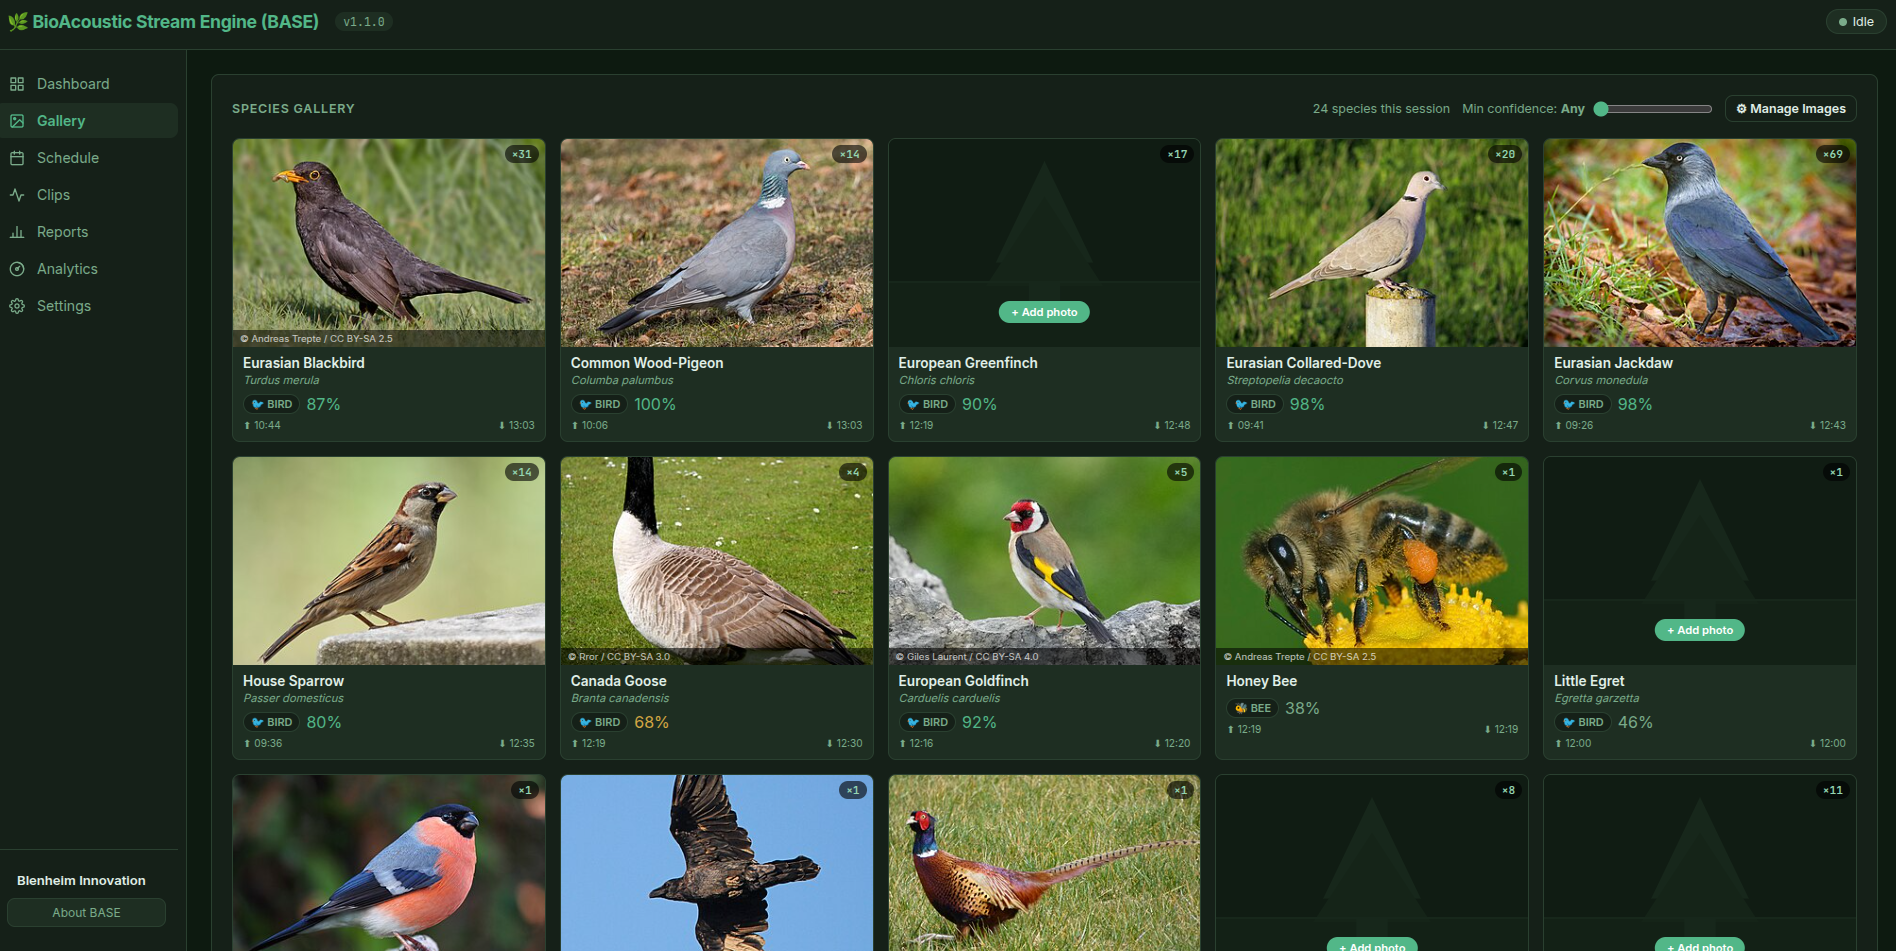
Powered by BirdNET — a deep learning model from Cornell Lab of Ornithology — BASE identifies over 6,000 species from three-second audio clips. Every song, call, and contact note is logged with a confidence score and timestamp.

Bats echolocate far beyond the range of human hearing. An ultrasonic microphone captures calls at 384,000 samples per second; BASE identifies 17 UK and European species and can pitch calls down into the audible range so you can listen in.

Every insect in flight produces a characteristic wing-beat buzz. BASE detects insect flight activity as a proxy for pollinator presence — a rapid, non-invasive way to monitor how pollinators are using a habitat through the day.

Orthoptera — grasshoppers, bush crickets, and field crickets — stridulate at characteristic frequencies. BASE runs a custom-trained AI to identify species from their song, tracking which grassland insects are present and how active they are.

A carbon-fibre probe conducts sub-surface vibration — earthworm movement, soil arthropod activity, root interactions — up to a contact microphone. The Soil Acoustic Index filters out traffic, aircraft, and machinery to leave only biological signal.

A submersible hydrophone in the Great Lake listens for fish choruses, spawning calls, and invertebrate clicks. The Water Acoustic Index scores each recording against flow noise and boat motors, isolating genuine biological activity.
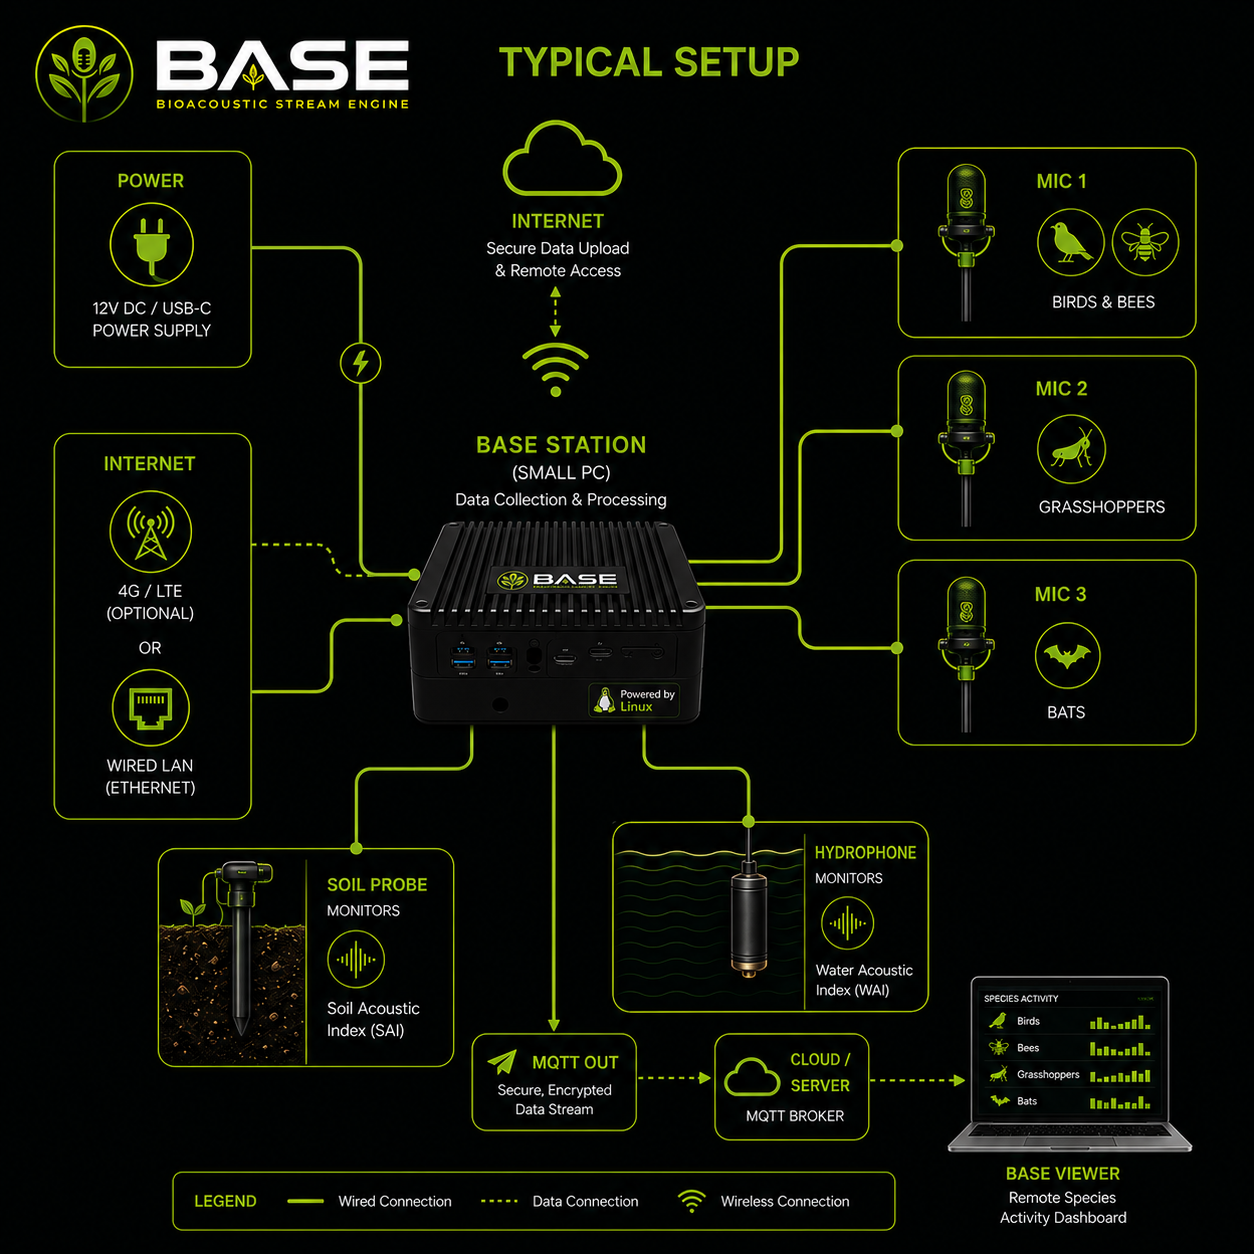
A small PC, a handful of microphones, and a power supply. BASE handles the rest.
Microphones placed around the estate stream audio into BASE around the clock. Each monitoring location has its own schedule — waking at dawn chorus, dusk, or any window you configure.
Each three-second clip is passed through the relevant AI model. The model compares the sound's acoustic fingerprint against thousands of reference recordings and returns a species name with a confidence score.
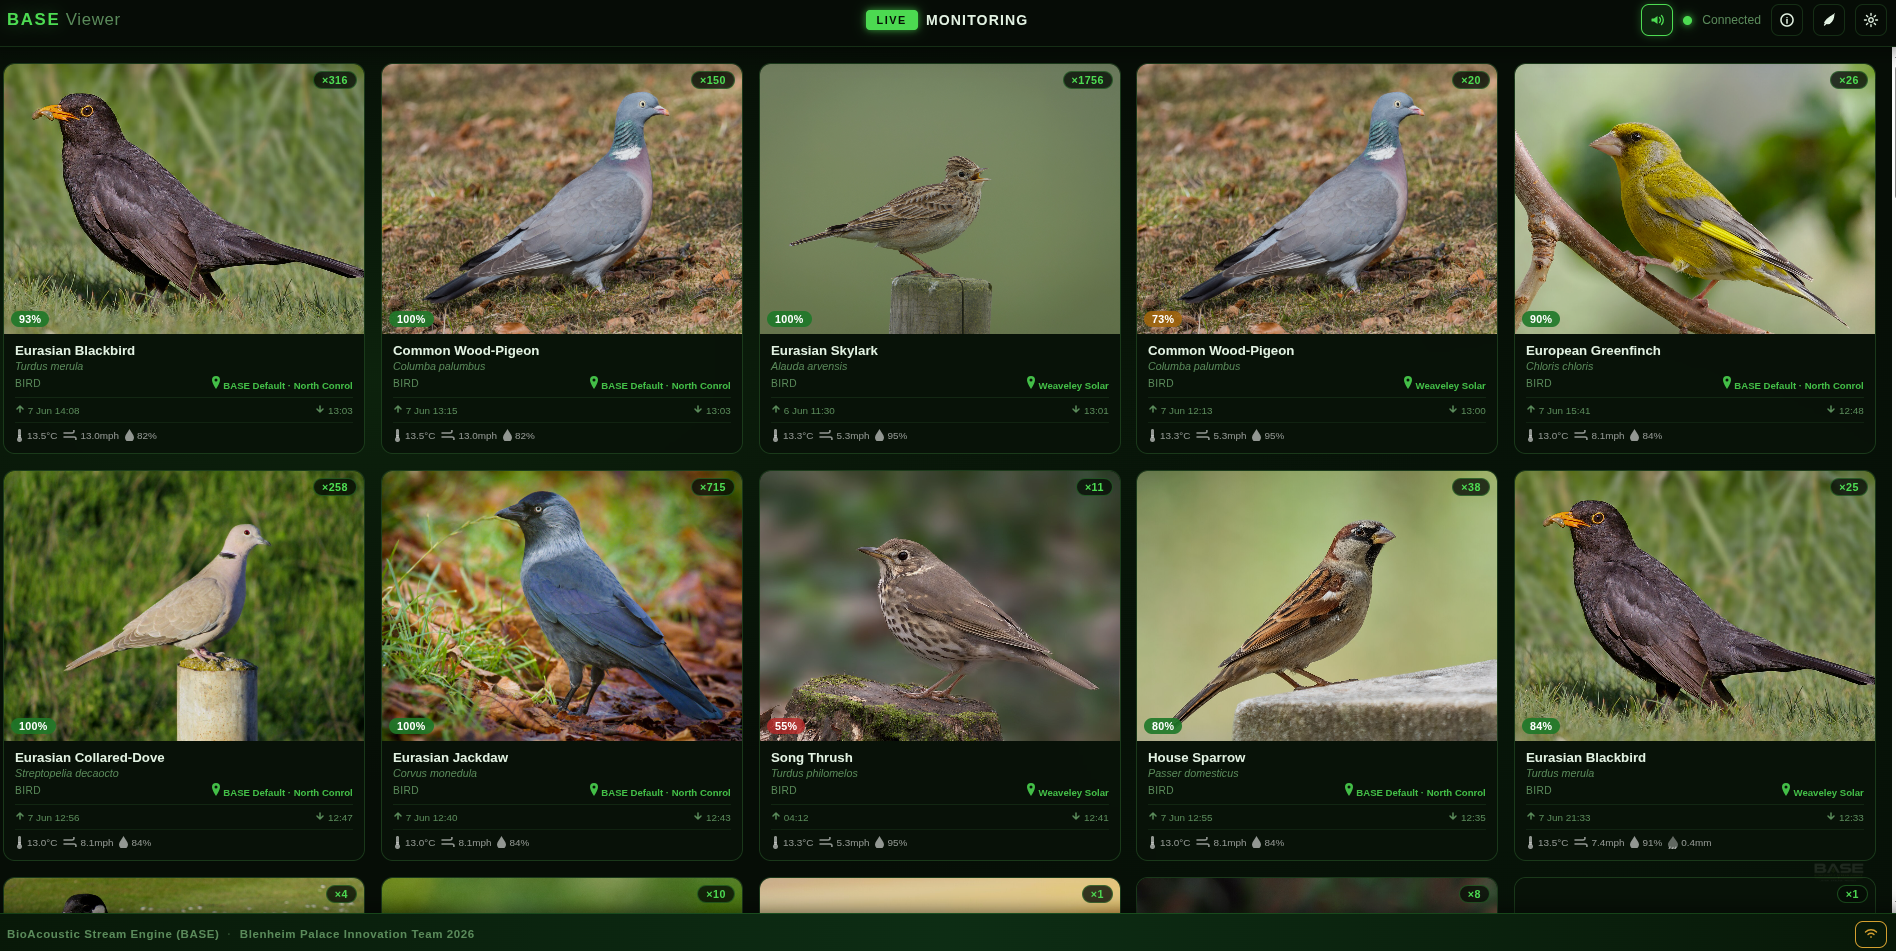
Every detection appears on the dashboard in real time — species name, confidence, monitoring location, and weather conditions at the moment of detection. Audio clips are saved for review and download.
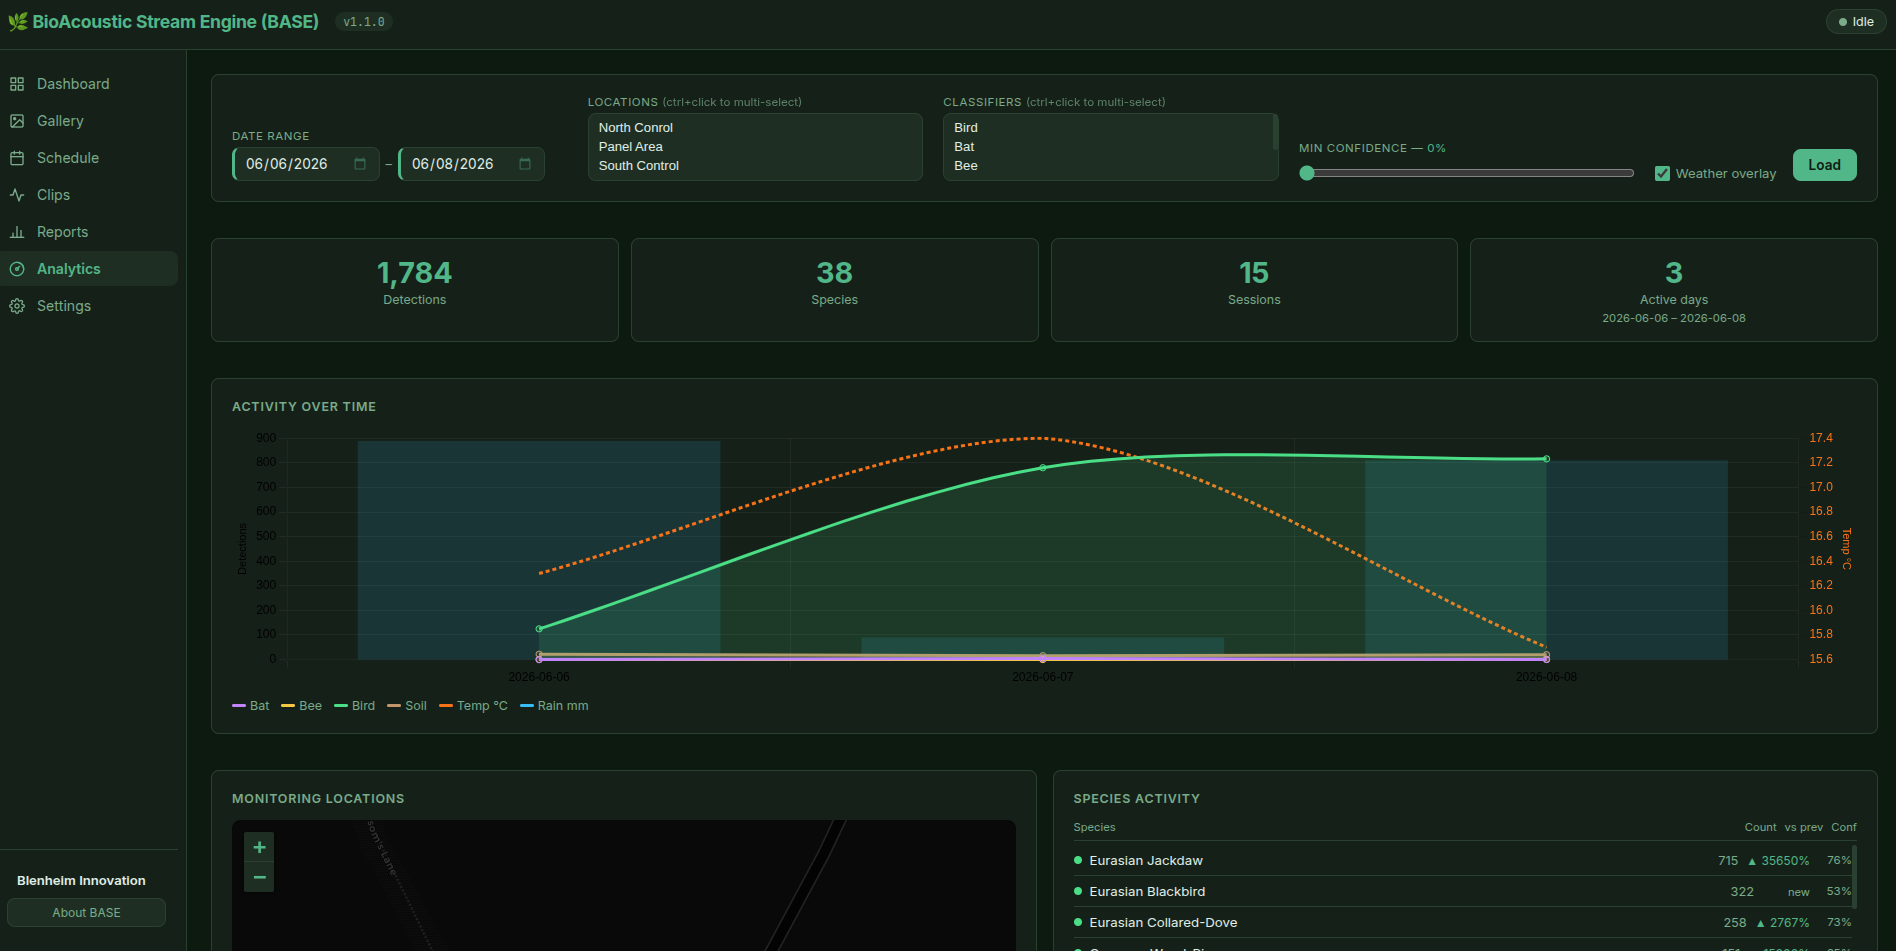
The Analytics page shows species activity over time, trends against previous periods, and maps every monitoring location. Detection data is exportable as CSV for further analysis or publication.
No specialist knowledge needed — here is exactly what happens between a microphone picking up a sound and BASE logging a species name.
Sound is air pressure changing very rapidly. A microphone turns those pressure changes into an electrical signal — a long, wiggly line of numbers that represents the loudness of the sound at each fraction of a second. On its own, this waveform is hard to read. You cannot look at it and tell whether you are hearing a Robin or a car.
A mathematical operation called a Short-Time Fourier Transform slices the recording into tiny overlapping windows and asks: "at this exact moment, how much energy is in each pitch?" The result is a spectrogram — an image where left-to-right is time, bottom-to-top is pitch (from deep rumbles at the bottom to high squeaks at the top), and brightness shows how loud each pitch is at each moment. A Robin's song appears as a cluster of bright smears in the mid-range. Traffic appears as a constant bright smear along the bottom. Silence is dark. Every species leaves a different visual fingerprint.
The spectrogram is fed into a deep learning model — a convolutional neural network (CNN). This is the same family of algorithm used to recognise faces in photographs or identify objects in video. It was trained on millions of labelled examples: "this pattern is a Great Tit", "this pattern is a Common Pipistrelle", and so on for thousands of species. Through training it learned which shapes, streaks, and pulses belong to which species — and it can spot those patterns even when mixed with wind noise or birdsong from other birds.
The model returns a score between 0 and 1 for every species it knows. A score of 0.9 for Robin means it is very confident; 0.3 means it heard something vaguely Robin-like but is not sure. BASE applies a confidence threshold (0.7 by default, adjustable per species) — only detections above that threshold are logged. Every logged detection links to the saved audio clip so you can listen back and verify.
The ground is full of sound — earthworms moving, beetle larvae chewing, roots growing under tension. The SAI turns a raw underground recording into a single number that reflects the biological richness of the soil.
A carbon-fibre probe pressed into the soil picks up vibrations too subtle for the ear. The recording is processed in three stages, each asking a different question about what is in the sound, and the results are combined into one index.
The Normalised Difference Soundscape Index divides the audio spectrum into two bands and compares them:
Result ranges from −1 to +1. Near +1: the recording is dominated by biological activity. Near −1: dominated by human-made interference. Near 0: roughly equal mix.
Root Mean Square (RMS) is simply the average energy in the recording — a measure of how loud the signal is overall. Before any analysis runs, BASE checks that the RMS clears a minimum threshold.
This step filters out recordings that contain only electrical background noise, wind interference, or sensor dropout. There is no point running a sophisticated biological analysis on silence. Recordings that fail the RMS gate are flagged as "no signal" and excluded from the index calculation.
Biological soil activity tends to produce brief, sharp events — an earthworm retracting through its burrow, a beetle larva chewing through organic matter, a root fibre snapping under tension, an ant colony responding to a disturbance. These are transients: sounds that appear suddenly and decay quickly.
Continuous sounds like traffic or machinery have a smooth, sustained waveform. Transients have a spiky statistical signature called high kurtosis (the waveform has sharp peaks rather than a steady hum). BASE counts how many kurtosis-spike events occur per second above a set threshold — this is the Transient Score, and it correlates strongly with active soil biology.
The SAI is tracked over time and compared against seasonal baselines. A sustained drop in SAI can signal a change in soil biology — from compaction, flooding, pesticide use, or long-term ecological change. A rising SAI after rewilding or reduced tillage is a measurable sign of recovery.
The SAI score is useful for long-term trend analysis, but readings also need an at-a-glance level that anyone can read instantly. BASE converts the most biologically meaningful signal in each recording into a single integer from 1 to 50 — the Activity Index.
For soil, that signal is the transient gate — the crest factor of the biological frequency band, already normalised to a 0–1 range. A signal full of sharp, sudden events (worms, larvae, roots) scores near 1. A smooth continuous sound (traffic, aircraft hum) scores near 0. For water, BASE uses the Acoustic Complexity Index (ACI) instead — a measure of how much the spectrum changes from one time window to the next. High variability means biological sounds; steady flatness means flow noise.
Signal = transient gate (soil) or normalised ACI (water) — both in the range 0–1. Multiplying by 49 and adding 1 maps 0 → index 1 and 1 → index 50, giving a linear scale that always stays within bounds.
The Activity Index is stored alongside the raw score in every detection record and written to the CSV export. It is broadcast live over MQTT and the WebSocket feed so the dashboard, gallery, and kiosk viewer can display it in real time.
A browser-based dashboard means no software to install. Run BASE on a Raspberry Pi, a laptop, or a field server — and monitor it from anywhere on the same network.
BASE is released under the MIT Licence. Conservation practitioners, researchers, and developers are welcome to use it, adapt it, and build on it. If you deploy BASE in your own work, we'd love to hear about it.
Installation takes a single script. BASE runs on any Linux machine — from a Raspberry Pi in a field box to a server in an estate office.
git clone https://github.com/blenheiminnovation/
BioAcousticStreamEngine.git
cd BioAcousticStreamEngine
bash install.sh